
Key performance indicators
Monitor leads and deals in a single executive dashboard for Bitrix24
Za darmo
-
Ocena
-
Instalacje98411
-
TwórcaAlaio, inc
Opis
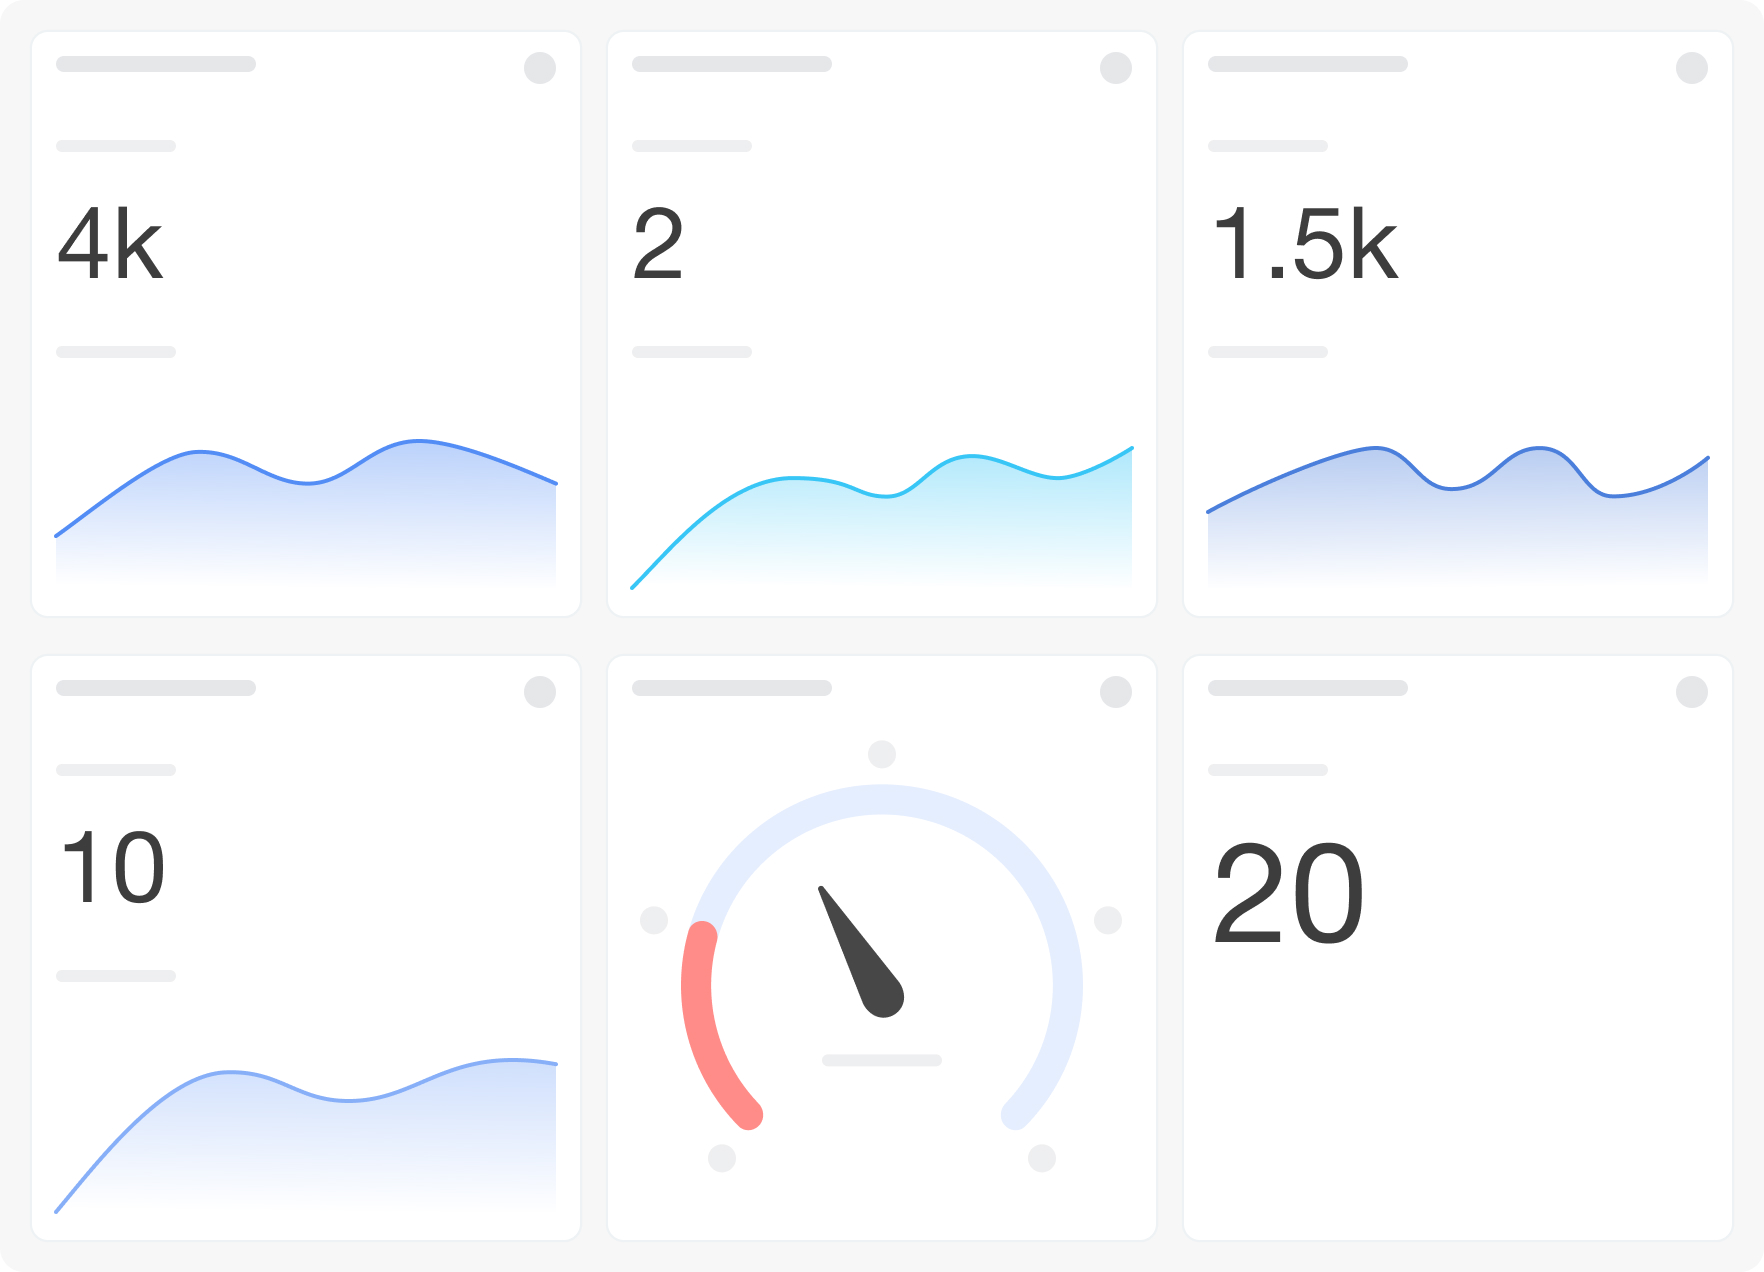
Business Overview gives executives and managers one screen covering the full funnel — from lead volume and quality through to deal revenue and conversion — without switching between separate reports.
Why businesses use it
Executive reviews require a unified view of business health. Separate lead and deal reports make it hard to see the full funnel in one place. This dashboard connects both data sources for a single, fast overview.
Business value
• See lead volume, sources, and conversion alongside deal revenue and KPIs in one view
• Monitor the full funnel from lead to closed deal on a single screen
• Track lead-to-deal conversion as a single cross-stage metric
• Filter the entire dashboard by responsible person, period, and pipeline
Common use cases
• Run weekly executive reviews with one dashboard instead of multiple reports
• Check funnel health — both lead quality and deal performance — at a glance
• Filter results by responsible manager or pipeline for team-level reviews
• Monitor whether lead volume changes are affecting downstream deal results
How it works
The dashboard connects to crm_lead, crm_deal, and lead_deal_source tables. Ten visualizations cover lead volume dynamics, lead source distribution, lead-to-deal conversion gauge, revenue dynamics, won deals trend, deal conversion rate, average deal size, in-progress portfolio (count and sum), and average close time. Filters: Period, Grouping, Responsible person, Pipeline.
FAQ
Our leadership team looks at leads and deals in separate reports and can never agree on what the full funnel looks like. Can this fix that?
Yes — this dashboard combines lead volume, lead source distribution, and deal revenue on a single screen. Everyone is looking at the same data in the same context.
We know how many deals closed but have no idea what happened to leads earlier in the funnel. Is that visible here?
The lead-to-deal conversion gauge shows the cross-stage conversion rate from qualified leads to successful deals — the full-funnel metric that single-stage reports miss.
When the responsible person filter is applied, does it affect both the lead and deal data or just one side?
It applies to all ten visualizations — both the lead and the deal sections update together when you filter by responsible person.
What is needed to connect to Bitrix24?
Access credentials for the Bitrix24 BI connector, configured during app installation.
Why businesses use it
Executive reviews require a unified view of business health. Separate lead and deal reports make it hard to see the full funnel in one place. This dashboard connects both data sources for a single, fast overview.
Business value
• See lead volume, sources, and conversion alongside deal revenue and KPIs in one view
• Monitor the full funnel from lead to closed deal on a single screen
• Track lead-to-deal conversion as a single cross-stage metric
• Filter the entire dashboard by responsible person, period, and pipeline
Common use cases
• Run weekly executive reviews with one dashboard instead of multiple reports
• Check funnel health — both lead quality and deal performance — at a glance
• Filter results by responsible manager or pipeline for team-level reviews
• Monitor whether lead volume changes are affecting downstream deal results
How it works
The dashboard connects to crm_lead, crm_deal, and lead_deal_source tables. Ten visualizations cover lead volume dynamics, lead source distribution, lead-to-deal conversion gauge, revenue dynamics, won deals trend, deal conversion rate, average deal size, in-progress portfolio (count and sum), and average close time. Filters: Period, Grouping, Responsible person, Pipeline.
FAQ
Our leadership team looks at leads and deals in separate reports and can never agree on what the full funnel looks like. Can this fix that?
Yes — this dashboard combines lead volume, lead source distribution, and deal revenue on a single screen. Everyone is looking at the same data in the same context.
We know how many deals closed but have no idea what happened to leads earlier in the funnel. Is that visible here?
The lead-to-deal conversion gauge shows the cross-stage conversion rate from qualified leads to successful deals — the full-funnel metric that single-stage reports miss.
When the responsible person filter is applied, does it affect both the lead and deal data or just one side?
It applies to all ten visualizations — both the lead and the deal sections update together when you filter by responsible person.
What is needed to connect to Bitrix24?
Access credentials for the Bitrix24 BI connector, configured during app installation.

Historia wersji
Wersja 4
bug fixes
27.08.2026
Wersja 3
bug fixes
03.07.2026
Wersja 2
bug fixes
05.12.2025


