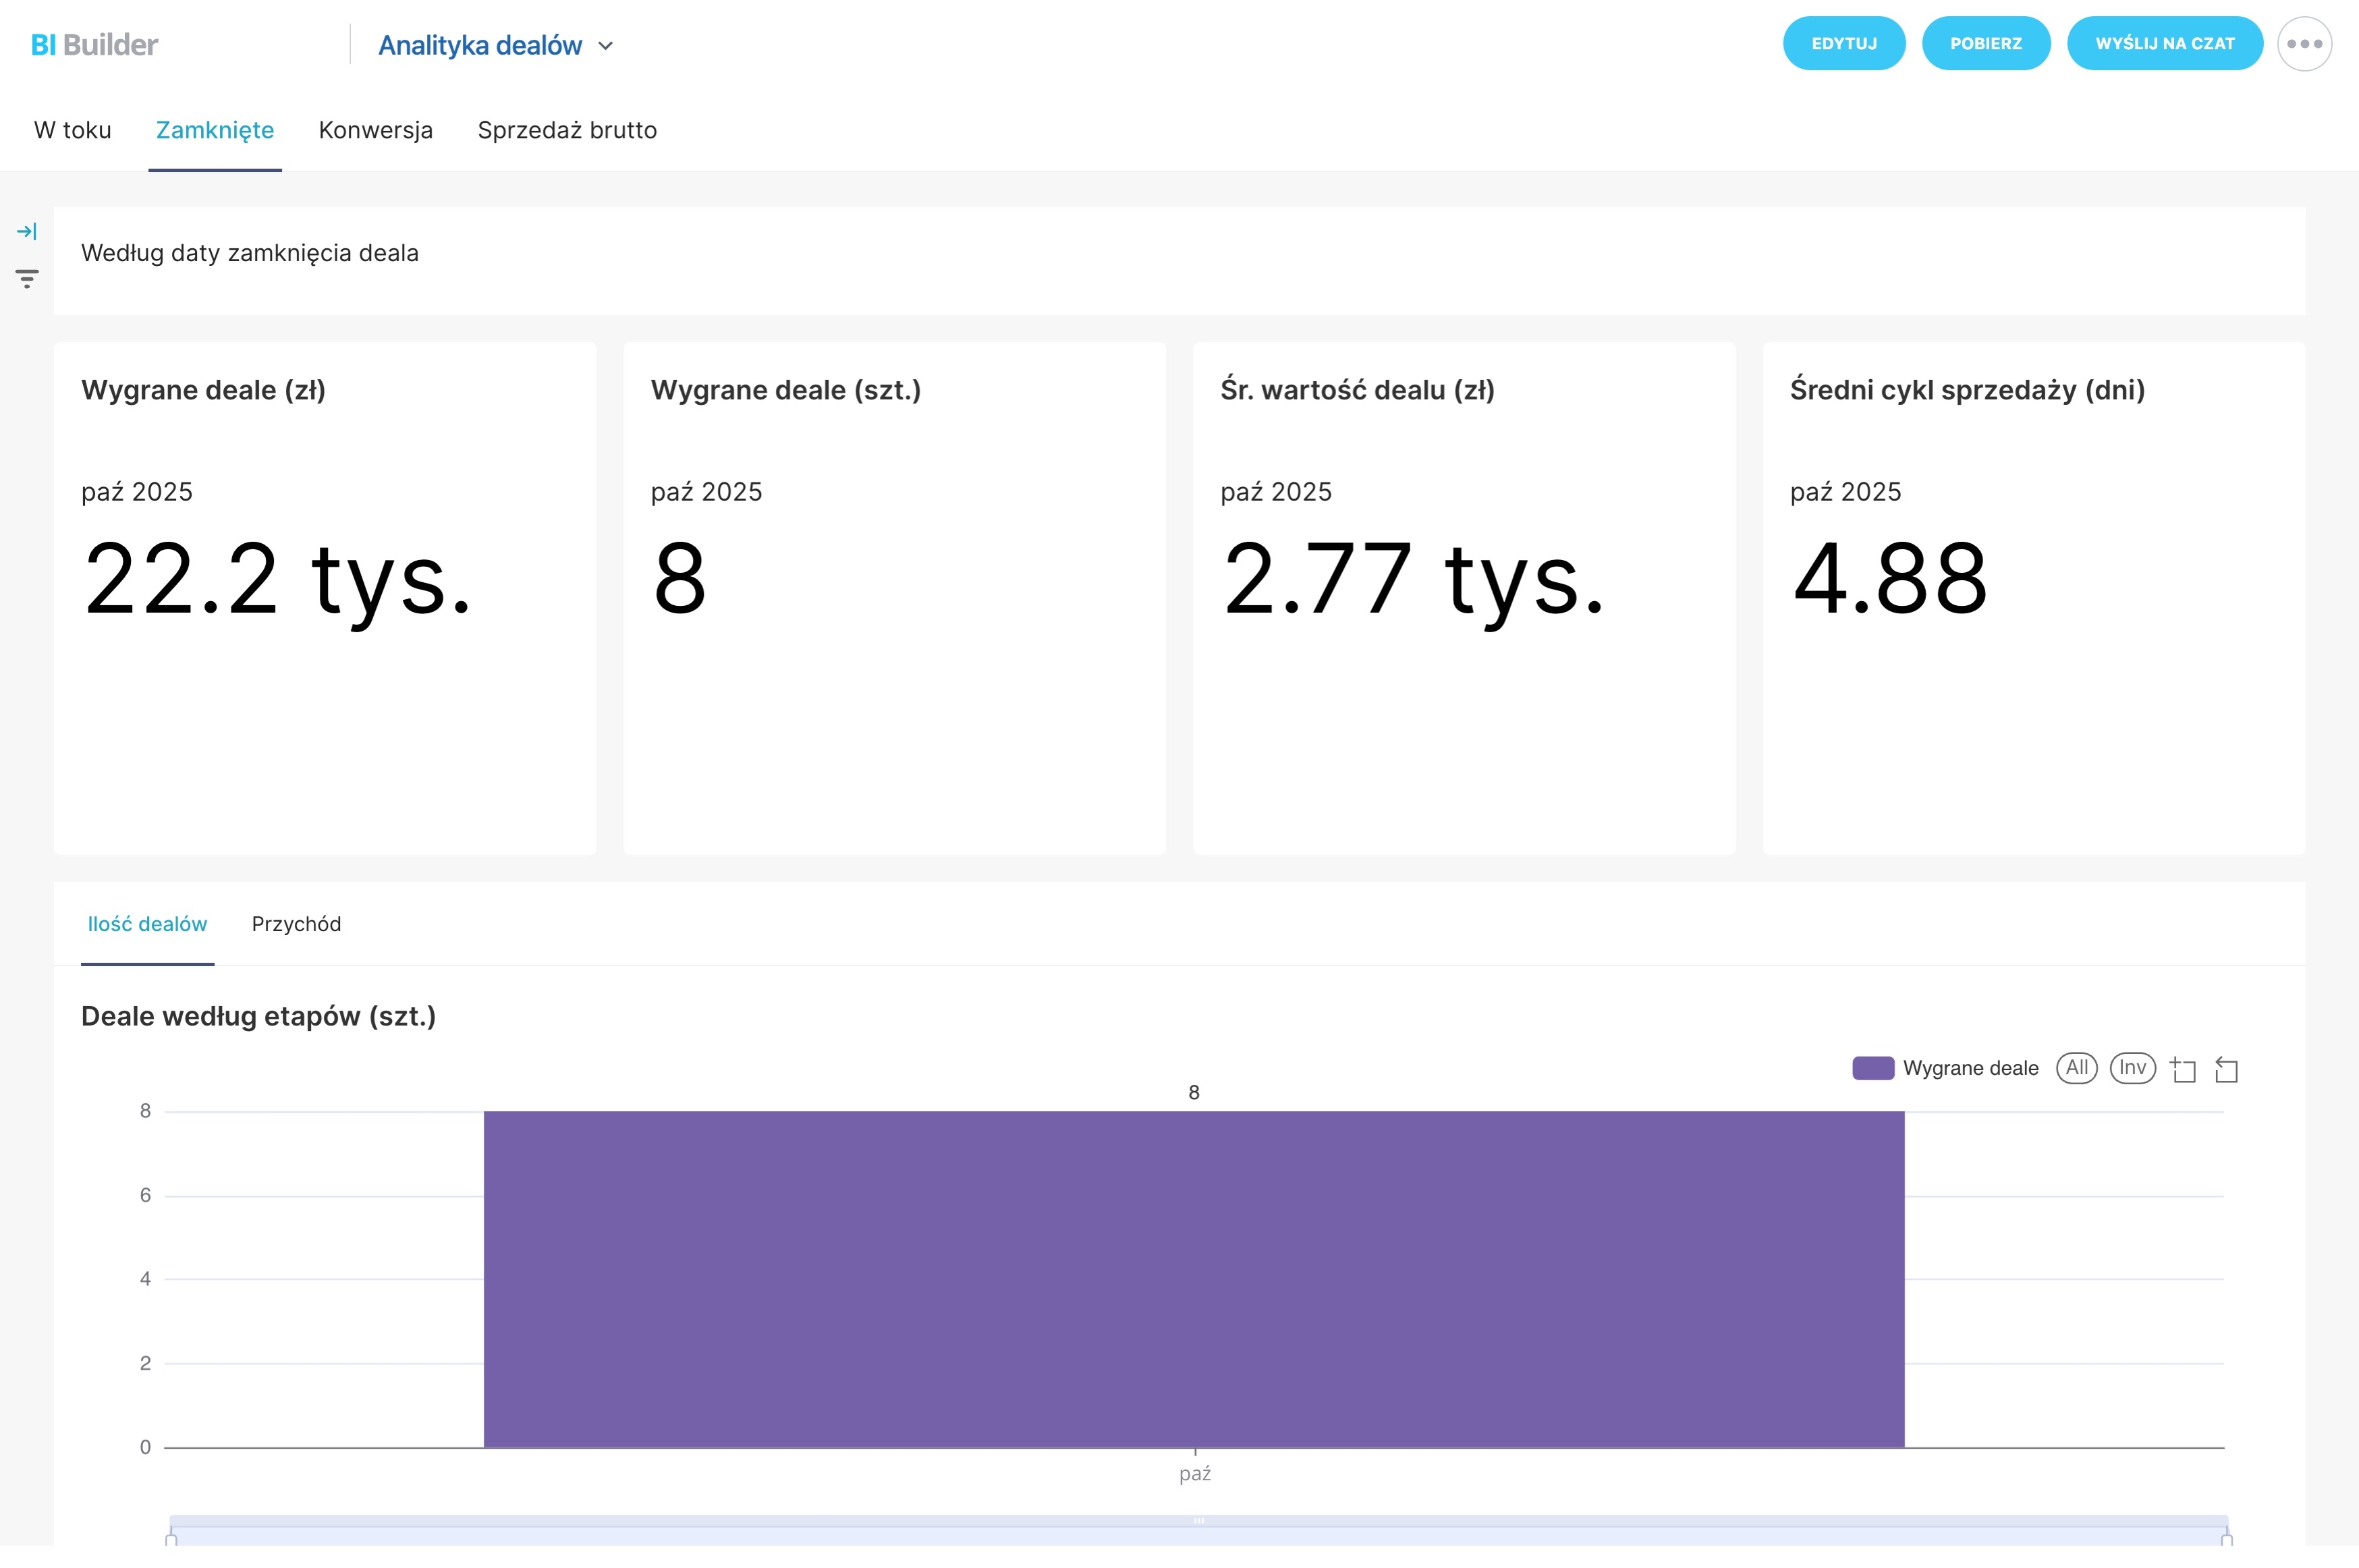
Configure reporting for your sales process
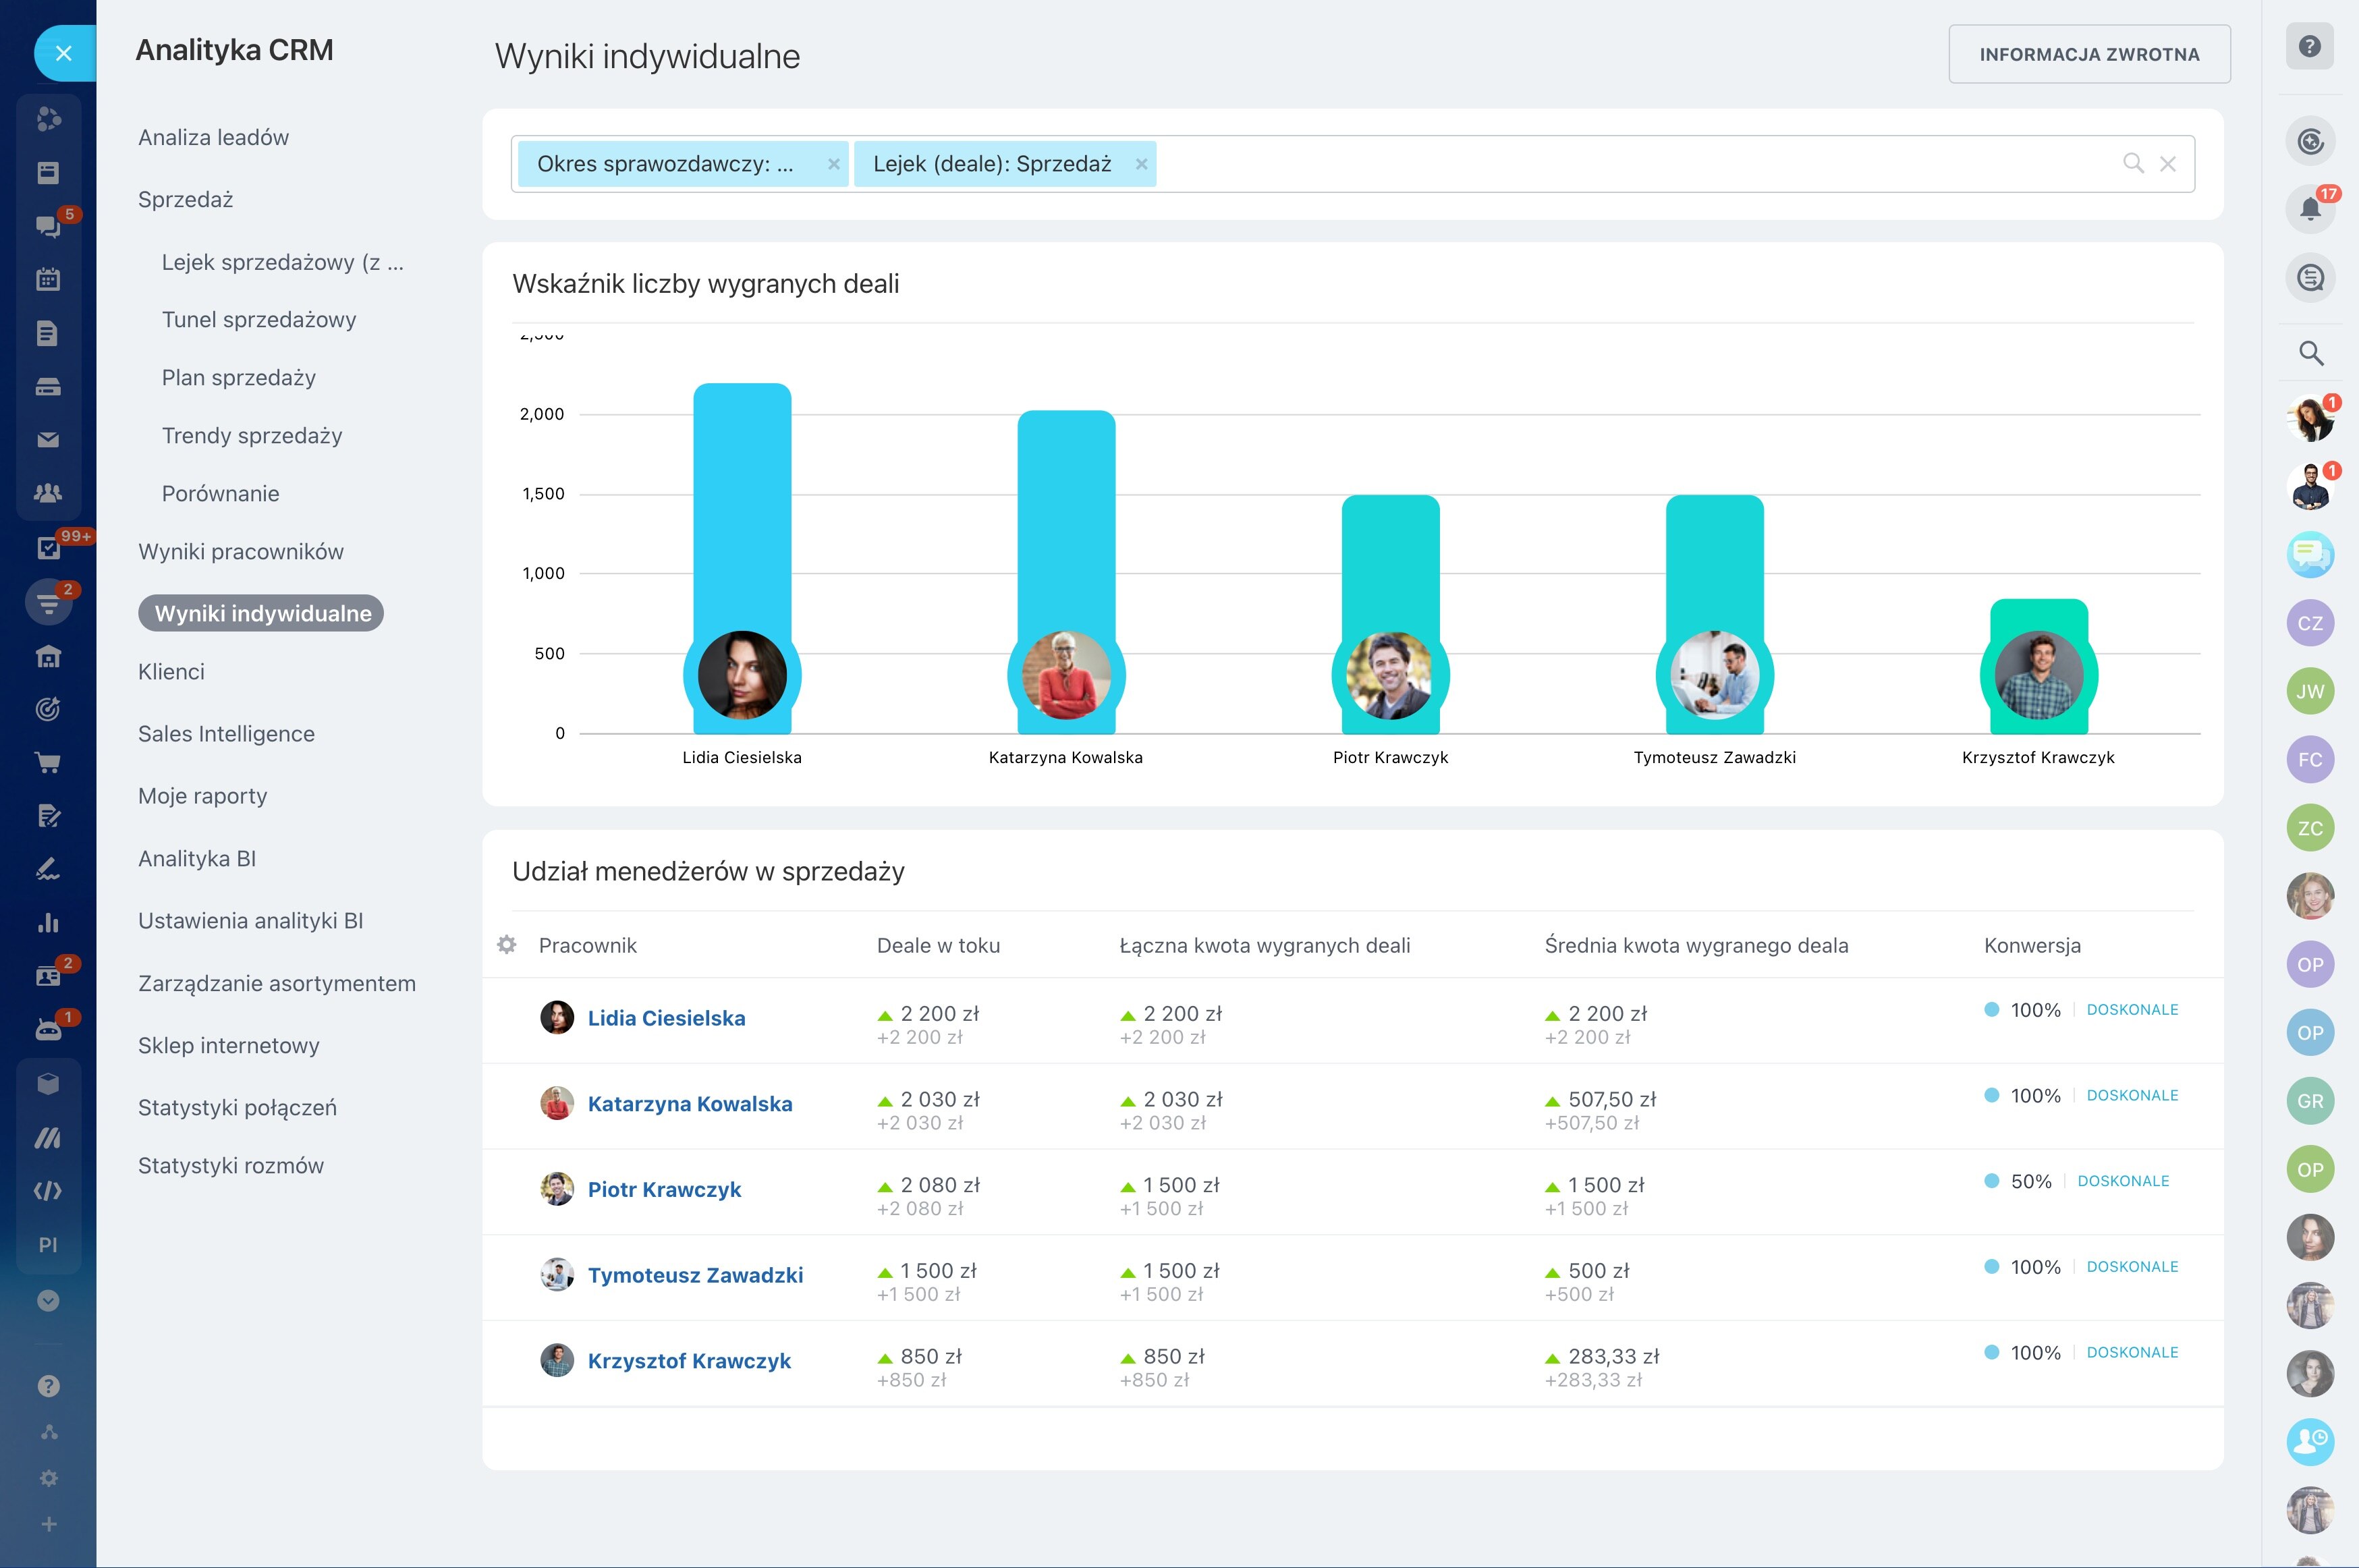
When a sales review requires separate checks of pipeline value, stage conversion, team activity, and won revenue, it becomes harder to see what needs attention first. A CRM analytics dashboard brings these indicators into one view, giving managers a consistent basis for reviewing performance.
In Bitrix24, CRM reporting can be organized around the sales process your team follows. Use the dashboard to spot a change, open the relevant opportunities or activities, and decide what action belongs next. The result is a review process that connects KPI monitoring with everyday CRM work instead of treating reporting as a separate task.
Configure reporting for your sales process
Set up the dashboard around the stages, records, and review cadence your team already uses. Select a focused group of indicators, define the reporting period, and connect each view to a concrete management question.
Also decide who reviews the dashboard, when the review happens, and which CRM updates should follow a significant change. This keeps reporting tied to an operating routine rather than a one-time snapshot.
Choose KPIs that explain pipeline health
Begin with the questions your sales team needs to answer regularly: how much value sits in each stage, where conversion changes, how consistently prospects receive follow-up, and what revenue has been won.
- Pipeline: opportunity volume and value by stage.
- Conversion: movement between stages or outcomes.
- Activity: recorded calls, messages, meetings, and other sales actions.
- Revenue: won deals and their associated value.
Turn dashboard signals into review decisions
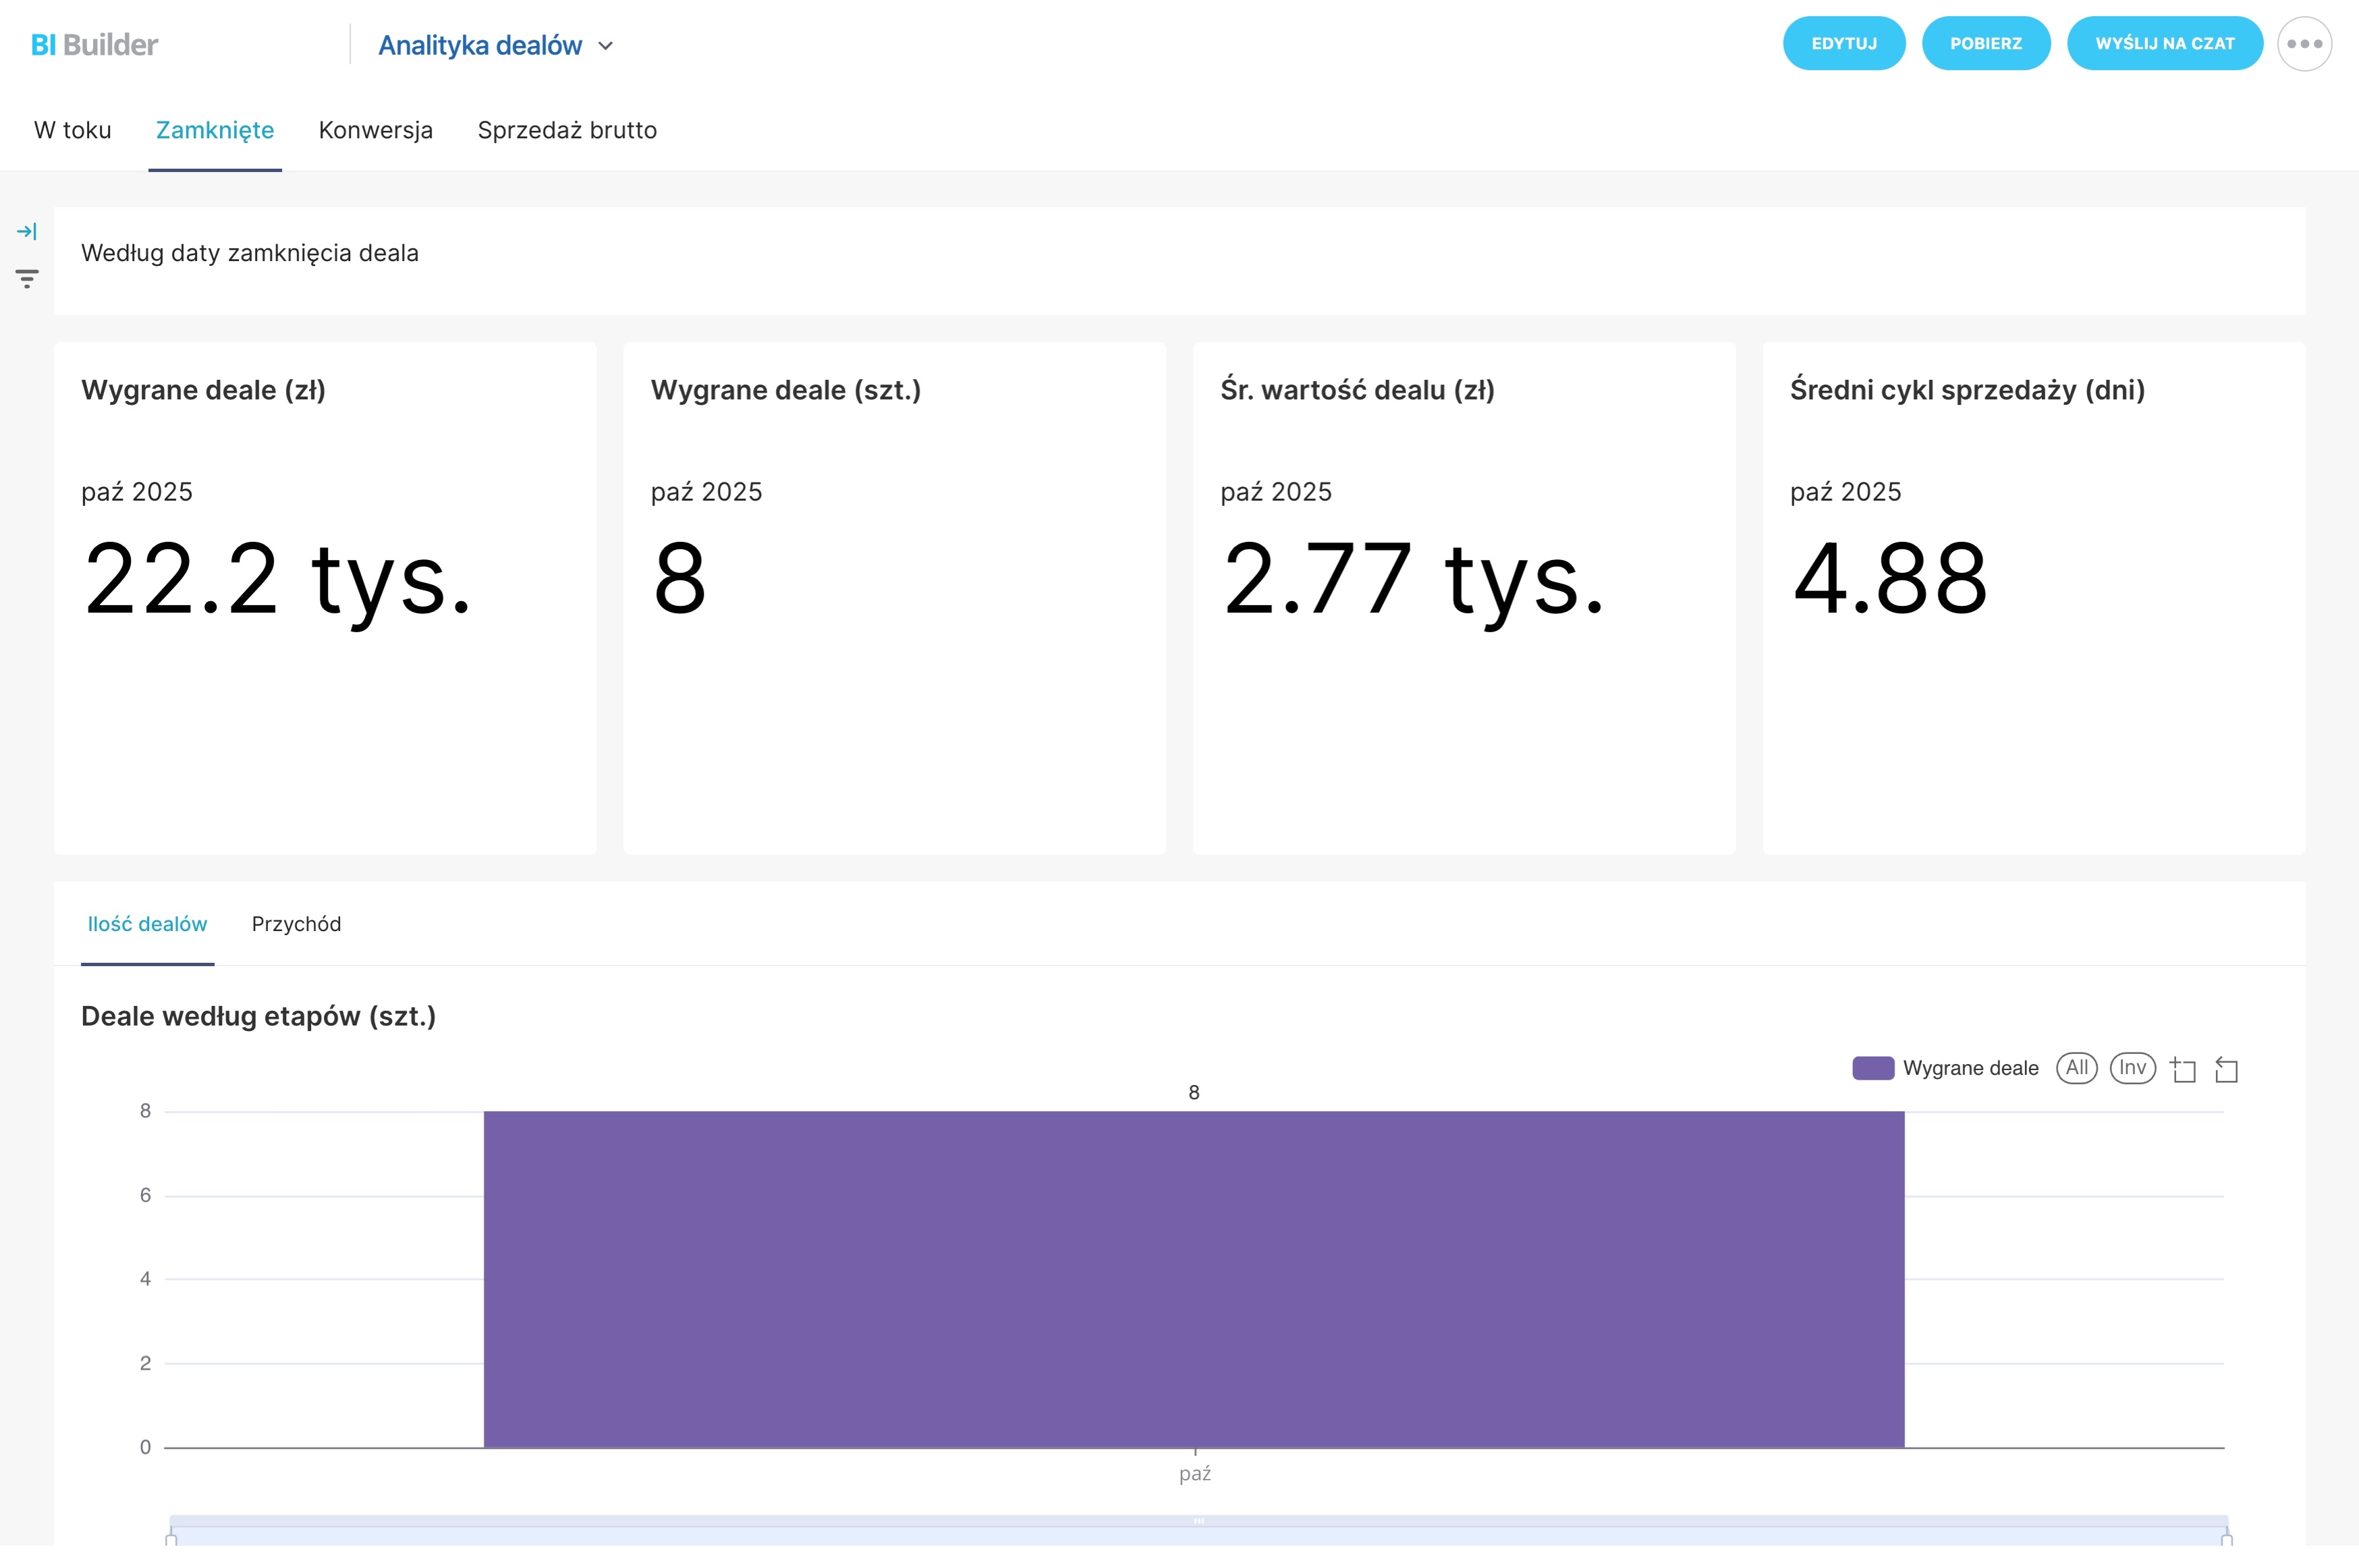
A dashboard is most useful when it supports a recurring sales review. Compare pipeline, conversion, and activity indicators, then decide whether attention belongs on a stage, a group of opportunities, or a follow-up gap.
The underlying CRM records provide the context for that decision. Managers can investigate the relevant deals and define the next action rather than discussing an isolated chart.
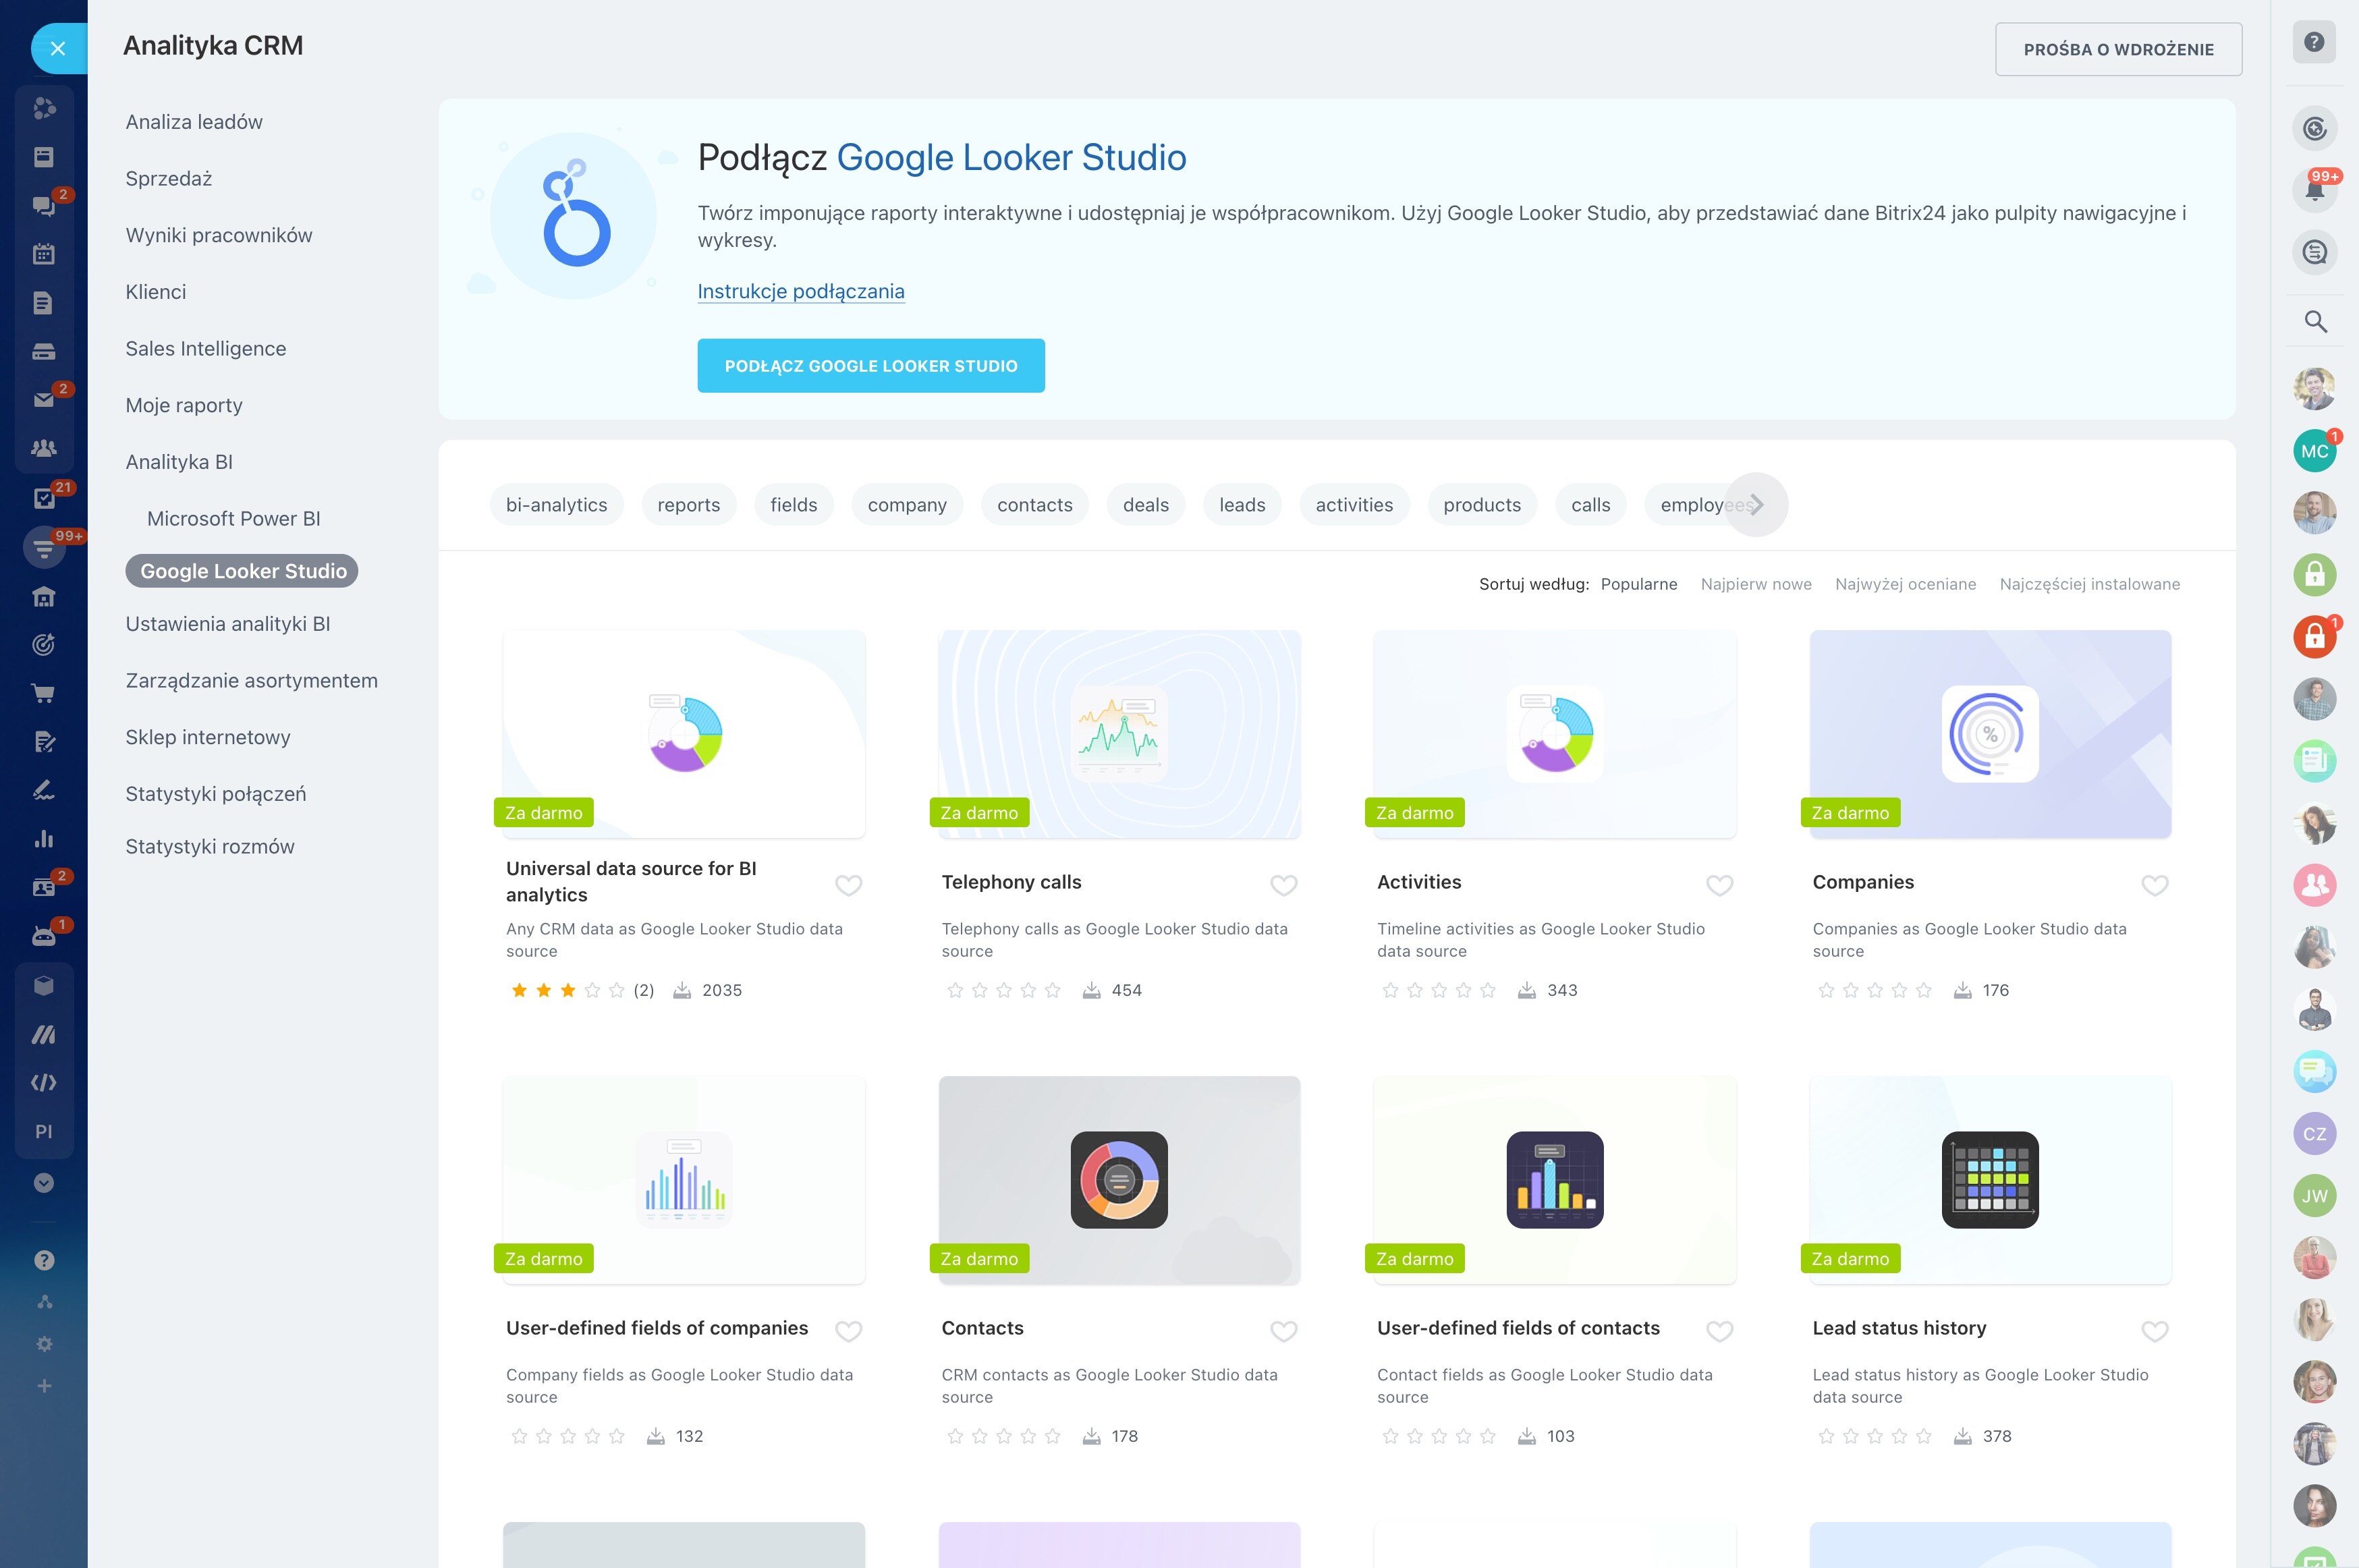
Use a KPI change to guide CRM action
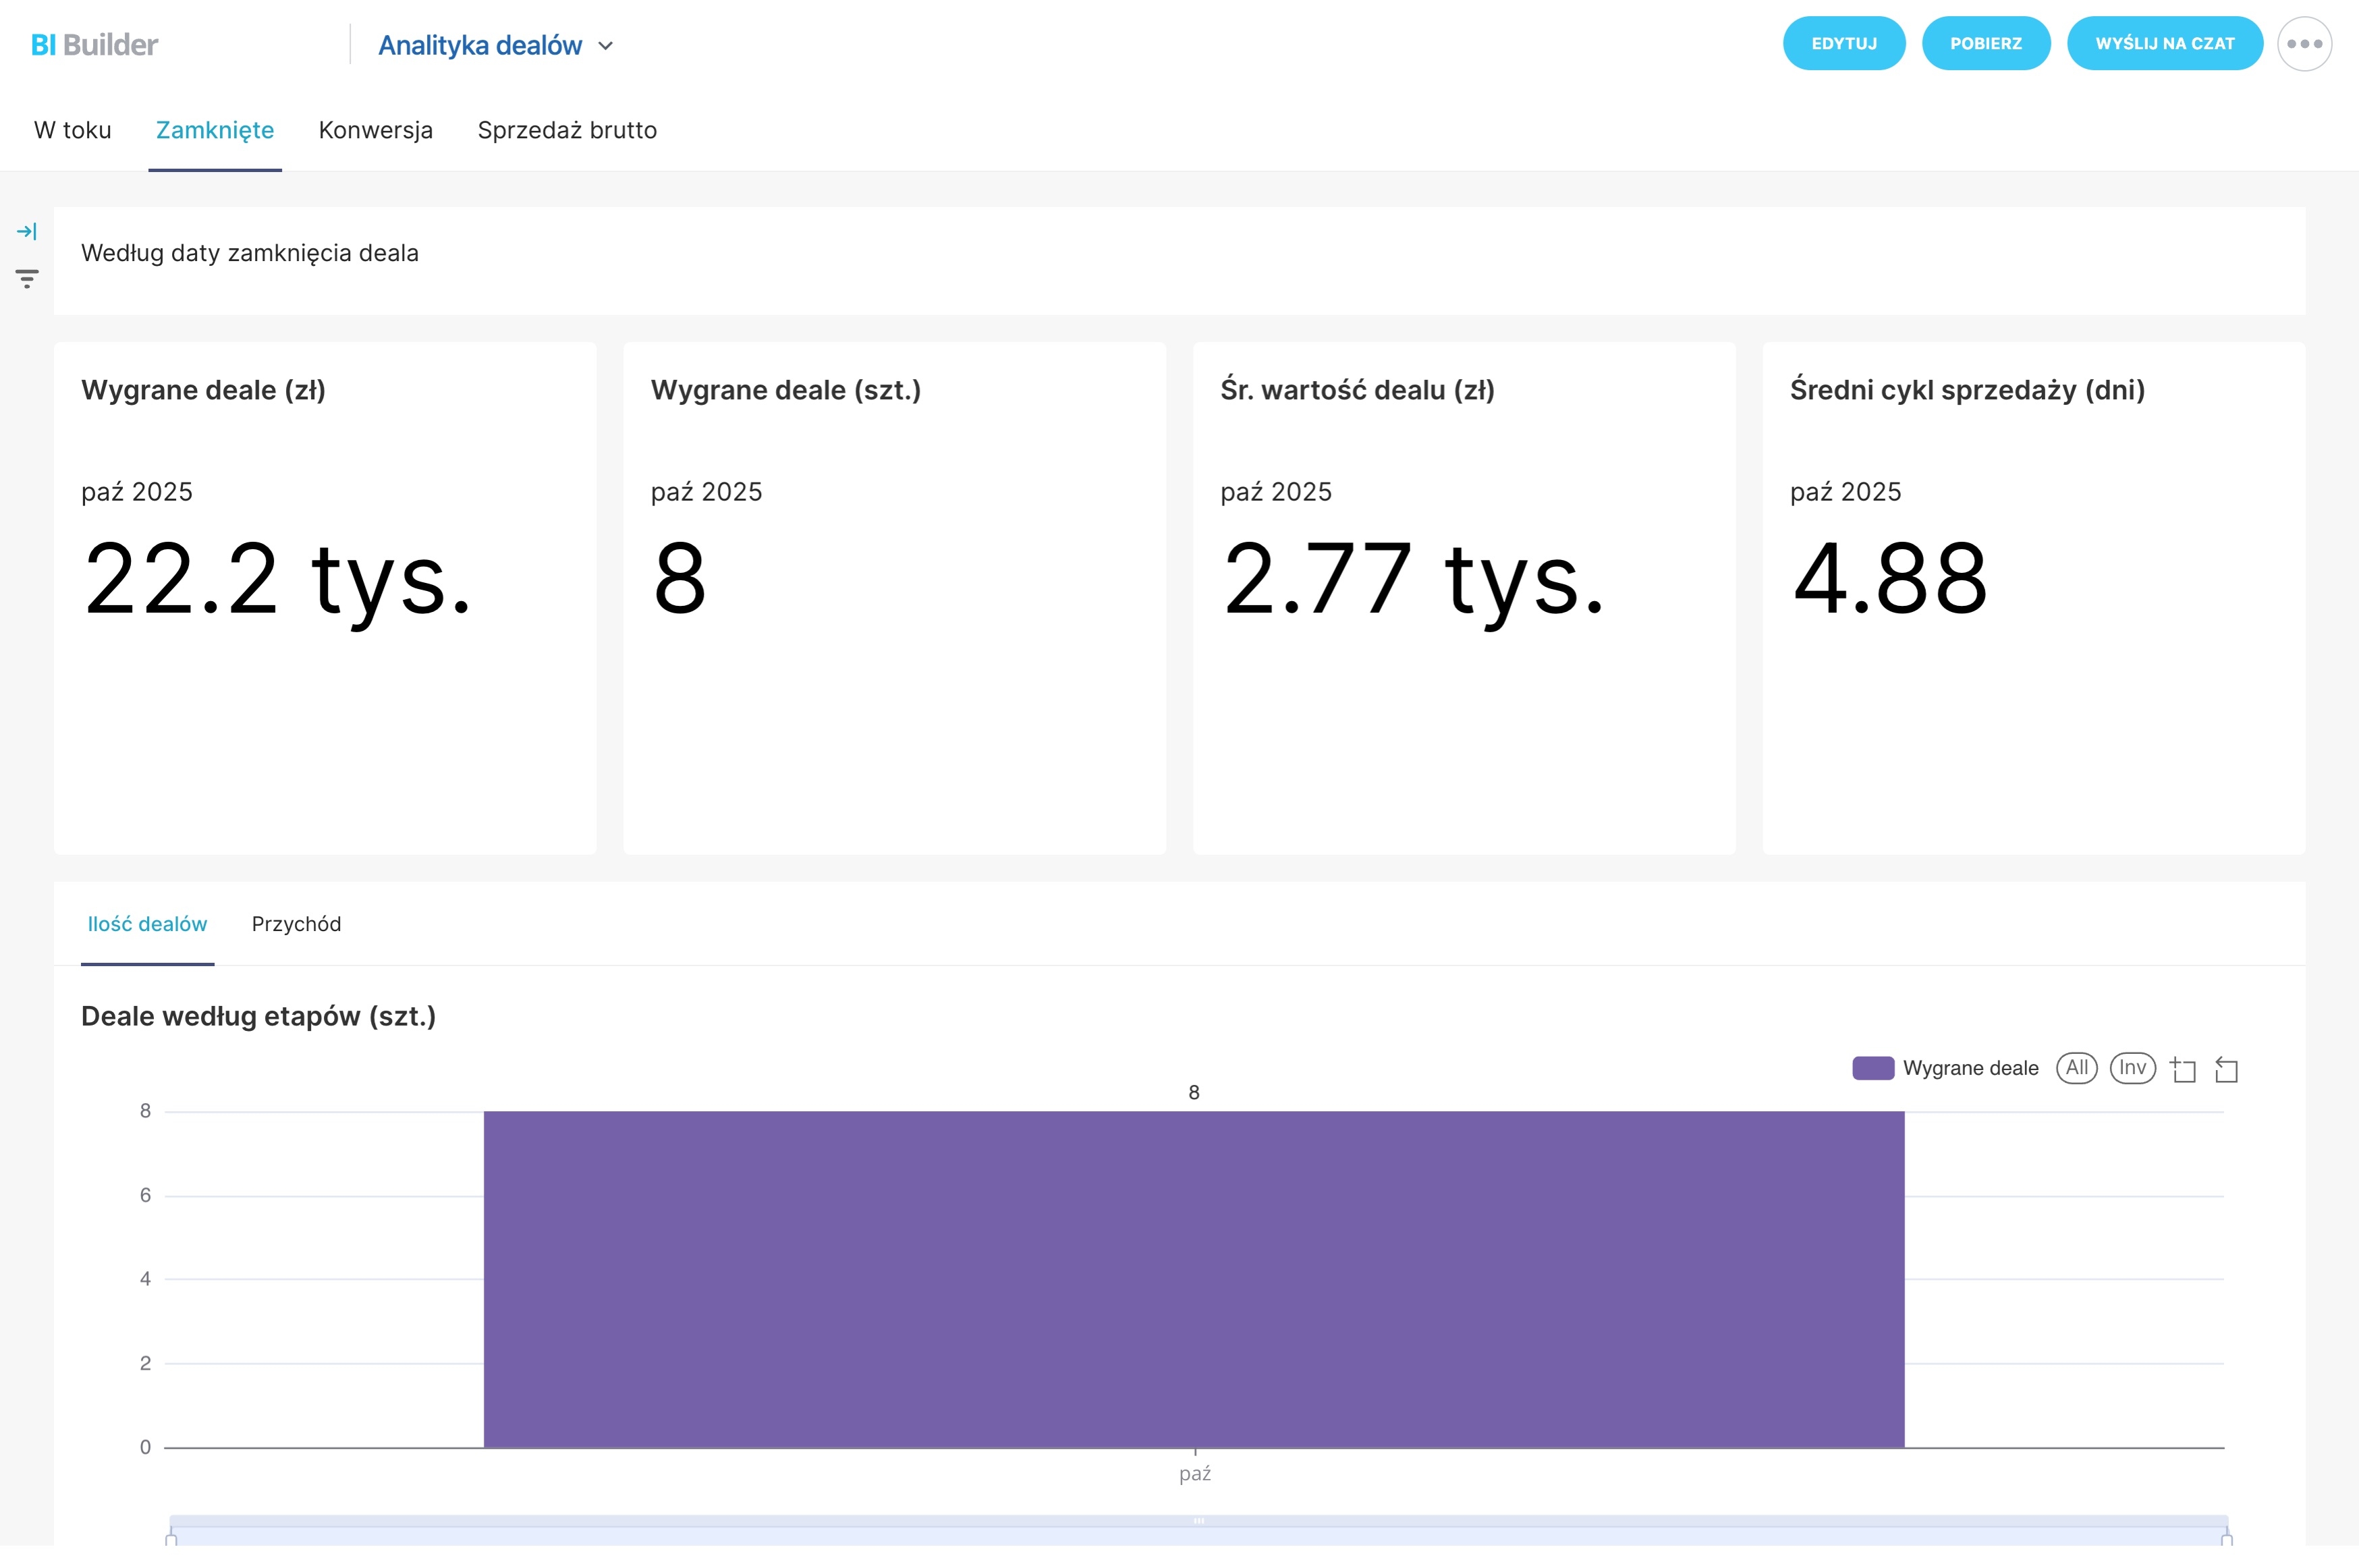
For example, the dashboard shows many opportunities staying in an early stage while conversion to the next stage declines. The trigger is the KPI change; the CRM action is to review those opportunities, update stages where appropriate, and plan the next customer contact.
The measurable outcome is a clearer set of active opportunities and a conversion trend that can be checked in the next review. Analytics informs the decision, while the CRM records document the work.
Align dashboard access with responsibilities
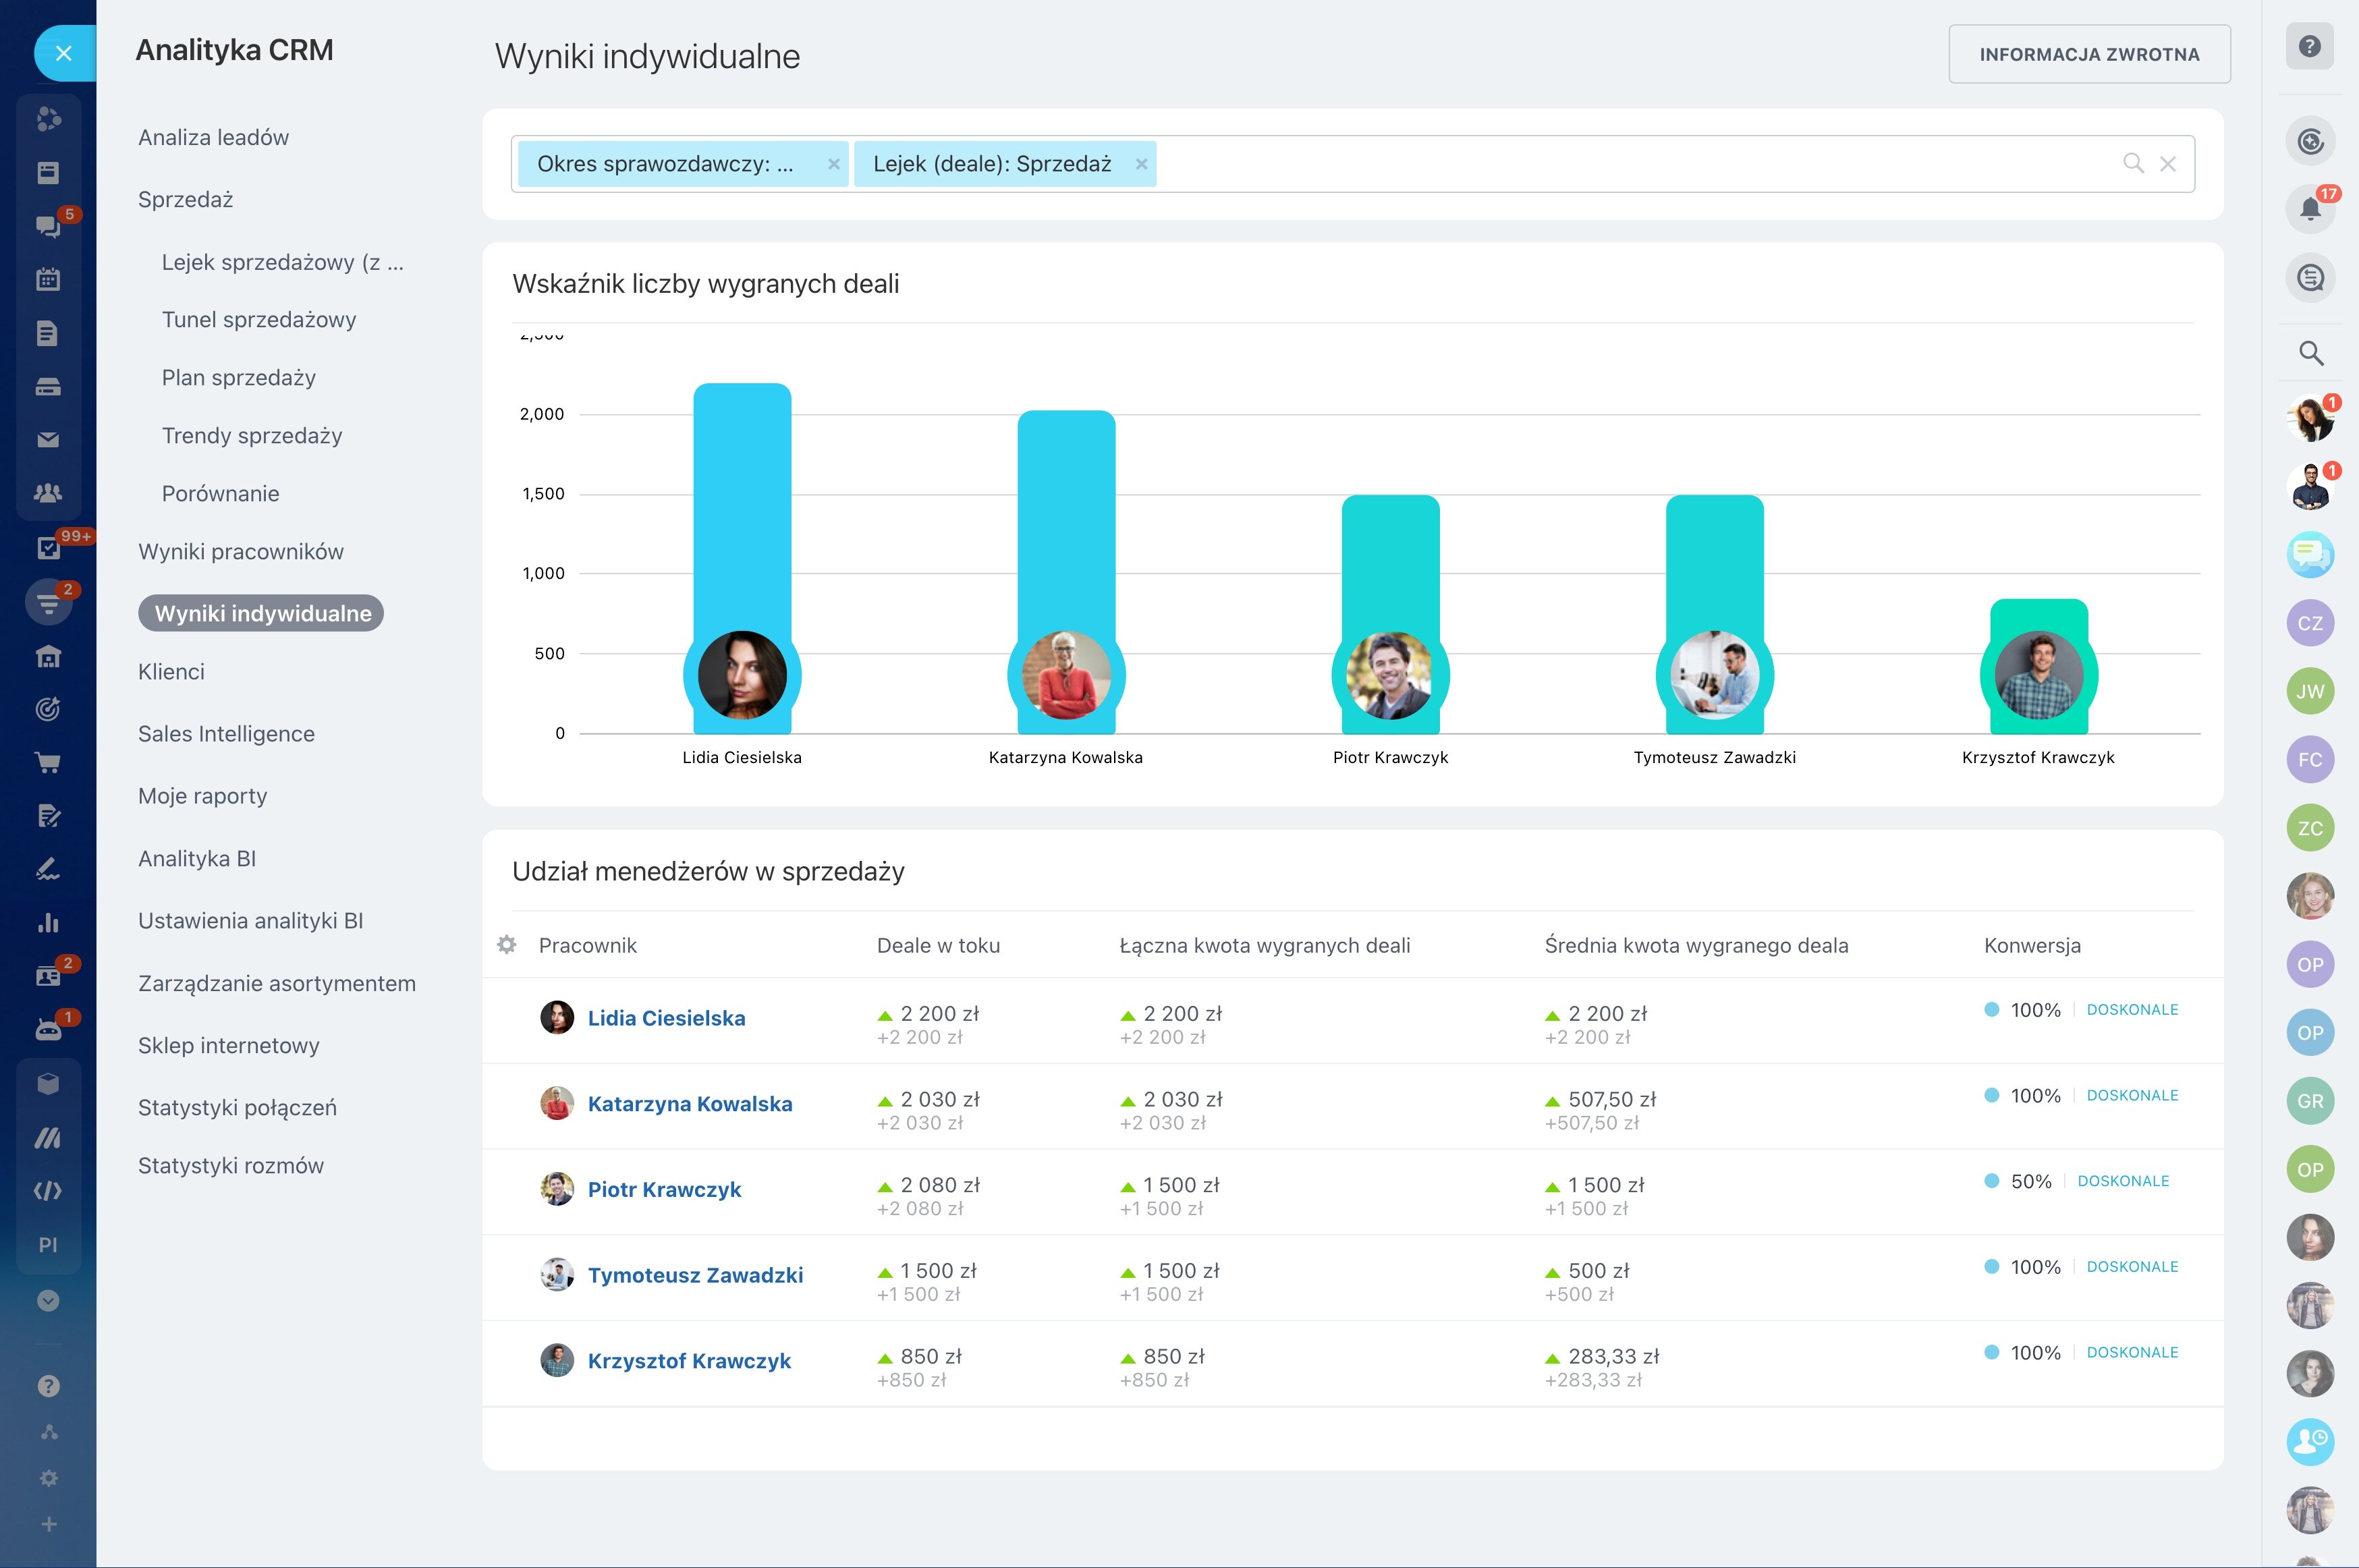
Dashboard visibility should reflect each person’s role. Representatives may focus on their own opportunities and activities, while managers may need a broader view for comparing pipeline movement and revenue across the team.
Align access with the CRM permissions and reporting responsibilities already used in your organization. Clear ownership helps keep KPI discussions focused on the records each person can review and update.
Move from KPI review to daily CRM work
A useful dashboard leads back to the records where sales work happens. After reviewing a KPI, open the relevant opportunities, contacts, companies, activities, or deal stages to confirm the context and record the next action.
This connection keeps measurement practical: reports show where attention may be needed, and the CRM provides the place to investigate, update records, and follow the result over time.
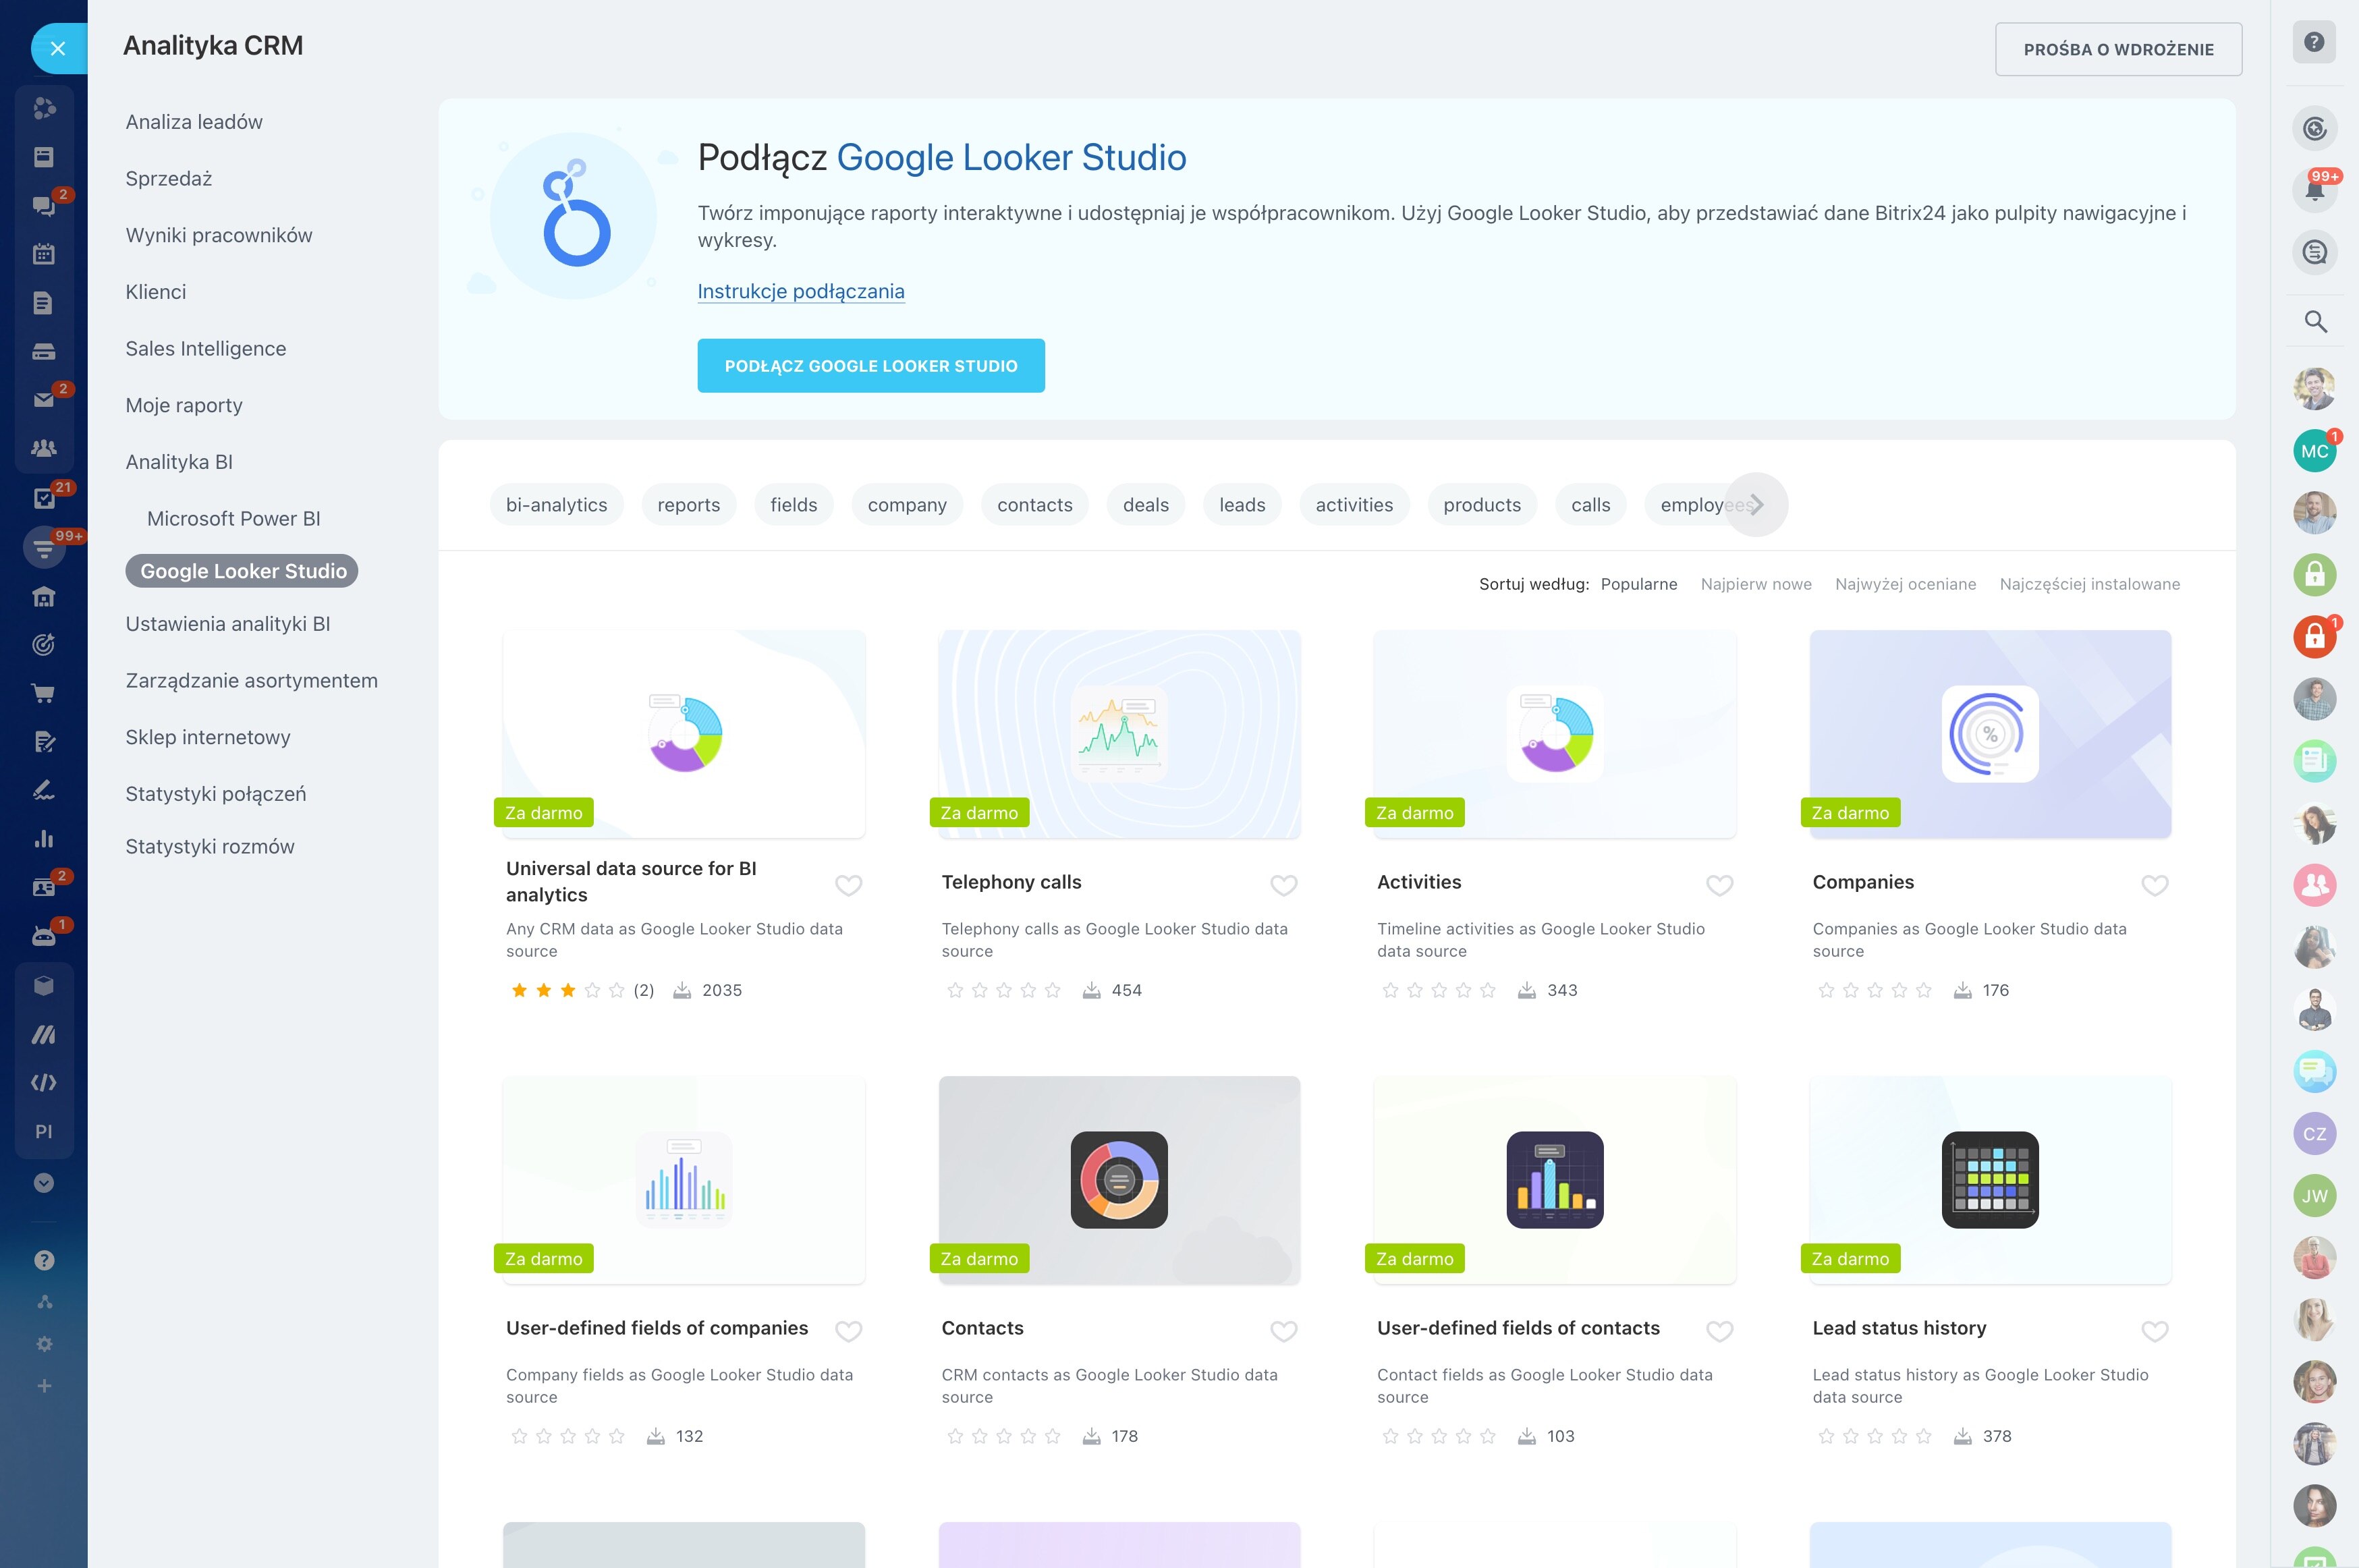
Compare CRM analytics dashboards by workflow fit
When evaluating CRM analytics dashboard software, check whether it reflects your sales stages, supports the KPIs managers actually use, and presents CRM data clearly enough for recurring reviews. Access rules and reporting habits matter as much as the number of available charts.
The best CRM analytics dashboard is the one that supports a repeatable loop: identify a change, investigate the relevant records, take a CRM action, and measure the next result.